
NOTE: This blog post was rewritten using AI (and then manually edited) from an original content magazine article written by me, James Hare, and based from original research that was also carried out by me.
Urban forestry is changing fast. Expectations are rising, budgets are tightening, and local authorities are being asked to deliver greener, healthier, more climate‑resilient places. Yet one of the most powerful tools available to urban foresters — canopy cover analysis — is still underused in strategic planning.
In this blog, I want to explore why canopy cover should sit at the heart of every Tree & Woodland Strategy (TAWS), how intermediate monitoring can transform decision‑making, and what we can learn from the recent Welwyn Hatfield Borough study — a project that revealed just how much insight is hiding in our canopy data.
🌳 The Urban Forest: Bigger Than the Trees We Manage
Forest Research defines the urban forest as “all trees in the urban realm – in public and private spaces, along linear routes and waterways and in amenity spaces” (Doick, 2024). That means:
- Street trees
- Parks and amenity spaces
- Residential gardens
- Institutional grounds
- Derelict land
- Agricultural edges
- Green corridors
- Water management spaces

Local authorities directly manage only a slice of this. The rest sits in private ownership — and is influenced indirectly through planning, TPOs, development control, and community engagement.
Most TAWS documents focus heavily on the public contribution. But if we want to influence the whole urban forest, we need to understand the whole picture.
📊 Why Canopy Cover Is the Most Useful (and Underused) Metric We Have
Canopy cover isn’t perfect — it’s a proxy for green provision, not a measure of species diversity or tree health — but it has three major advantages:
- It’s cheap and easy to collect.
- It’s easy to analyse in‑house.
- It’s easy to communicate to stakeholders.
Crucially: it measures distribution of the whole of the urban forest
That makes it ideal for strategic planning, especially when used at intermediate stages of the TAWS cycle where regular monitoring allows a progressive policy that is adaptive and ambitious. Canopy cover gives us a repeatable, comparable metric to do exactly that.
But canopy cover only becomes powerful when we understand how it’s calculated — and when we take control of the analysis ourselves.
🗺️ Why Boundaries Matter More Than You Think
One of the biggest pitfalls in canopy analysis is relying on predefined boundaries that distort the picture. Taking this example in Welwyn Garden City you can see that Sherrards LSOA has significantly greater canopy coverage than Peartree LSOA… however, approximately half of Peartree is industrial estate while half of Sherrards is woodland.
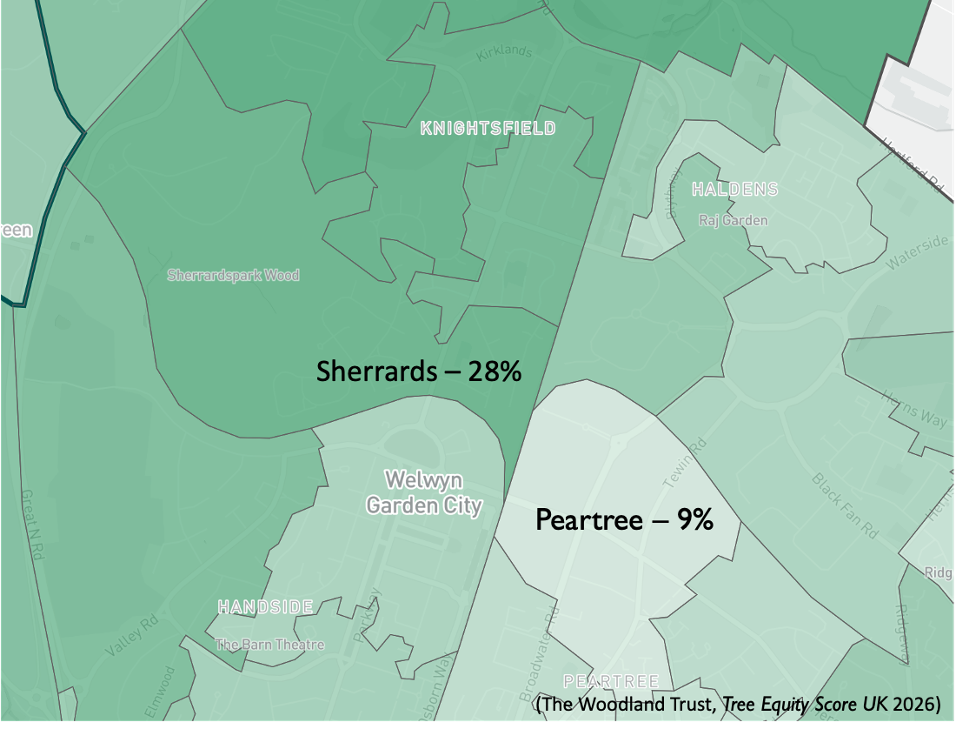
Comparing these two areas tells us nothing useful about canopy coverage, tree equity or management priorities.
My recent study on the urban forest at Welwyn Hatfield Borough Council looked to set out a different approach — asking a specific question and taking control of the analysis process to provide a more meaningful understanding of what is going on with the urban forest.
🔍 The Welwyn Hatfield Study: What Happens When You Ask the Right Question
The study set out to answer a simple but important question:
How does canopy cover differ between publicly and privately maintained land, and how is it changing over time?
The working hypothesis — one many urban foresters would instinctively agree with — was that public canopy cover was increasing faster than private canopy cover.
The data told a more nuanced story.
Headline findings (2010 → 2022):
- Public canopy cover increased from 19% in 2010 to 27% in 2022
- Private canopy cover increased from 13% to 19%
- Net change: 44% (public) vs 46% (private)
- Conservation areas combined increased 29%
- Non‑conservation areas increased 48%
This appears to contradict the hypothesis — but it also suggests something important: private land is responding to changing attitudes toward urban trees, even in areas that historically had low canopy provision.
It also hints at a natural upper limit: many wards have public land and conservation areas canopy coverage contributions already approaching the 30–40% ceiling seen in mature urban forests allowing for greater gains elsewhere.
🧭 Ward‑Level Insights: Where Strategy Becomes Targeted Action
The real value emerges when the data was broken down by ward where TAWS can be implemented to target canopy coverage gains in a smart way.
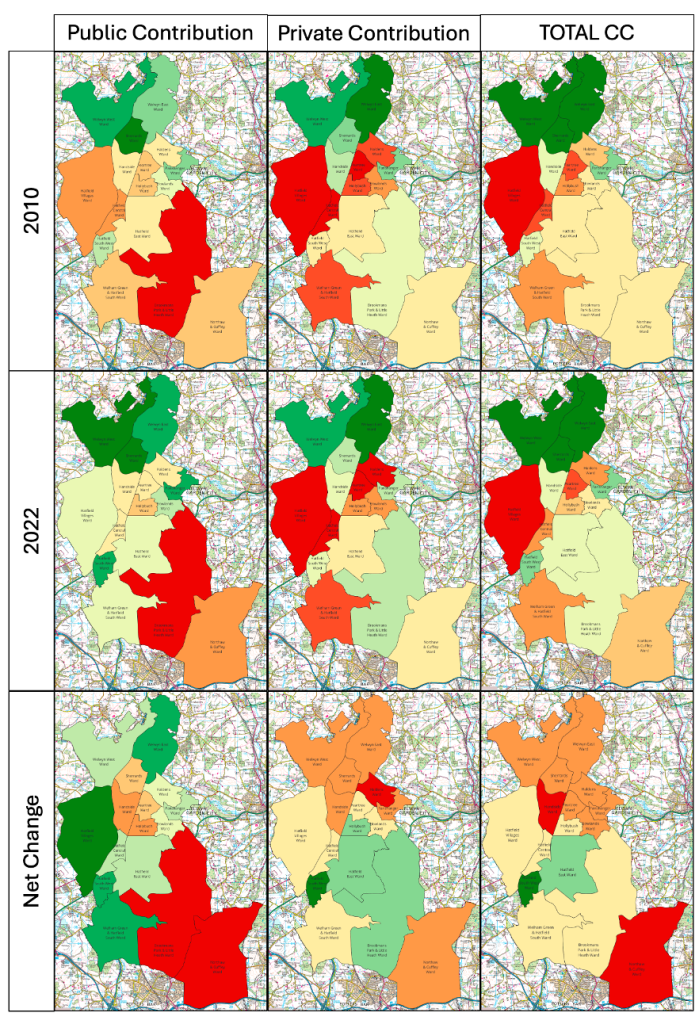
A few examples shown in the above image:
Brookmans Park & Little Heath
- Low public contribution
- Increasing private contribution
- Overall canopy rising
Implication: focus on public tree planting and public‑realm interventions.
Hatfield Villages
- High public contribution
- Low private contribution
Implication: strengthen planning controls, TPO reviews, and community engagement.
Handside vs Northaw & Cuffley
- Very different canopy levels
- Very similar (low) net change
Implication: both areas may be approaching structural or spatial limits.
These insights translate directly into actionable TAWS priorities:
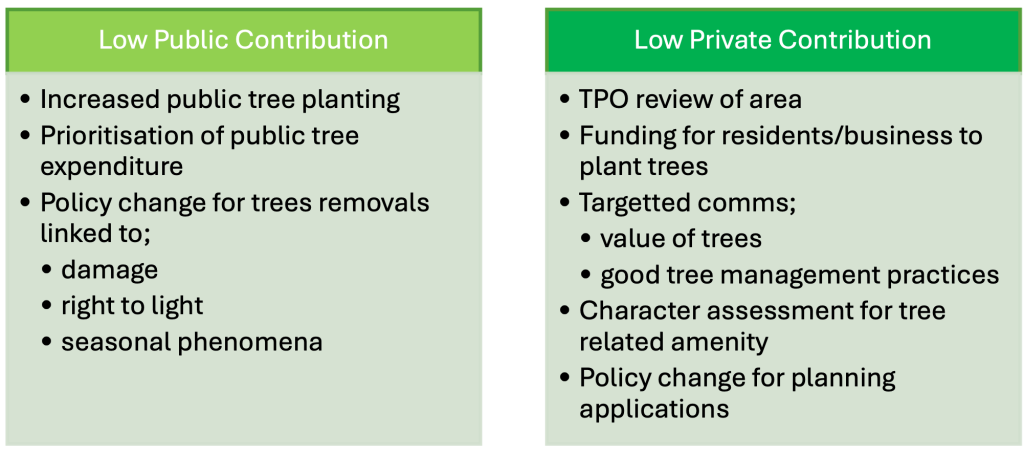
This is exactly the kind of targeted, evidence‑based approach TAWS documents should be built on.
🎯 Rethinking Canopy Targets: One Size Doesn’t Fit All
The national canopy target is 30%, echoed in the 3:30:300 rule. But the Welwyn Hatfield data shows:
- Many wards already exceed 30% public canopy
- Most wards fall well short on private canopy (average 18.8%)
This suggests a more realistic approach:
- Public land target: 30–35%
- Private land target: 20–25%
- Ward‑specific targets: based on land use, constraints, and opportunity
This is how canopy targets become meaningful rather than arbitrary.
🌱 The Bigger Picture: Canopy Cover as the Foundation of TAWS
Canopy cover isn’t the whole story — inventory analysis and eco‑reports provide essential detail on health, resilience, and ecosystem services. But canopy cover is the distribution. The starting point.
Canopy coverage, inventory analysis and eco-reports are three sides of the same question, but canopy coverage is the foundation that the others are built on.
And because canopy analysis is easy to repeat, it fits perfectly into the 5‑year assessment cycle recommended for strategic urban forest management.
🌍 Final Thoughts: A Call to Action
The Welwyn Hatfield study shows what’s possible when local authorities take ownership of their canopy data:
- Canopy cover is increasing — but unevenly
- Public and private land play different roles
- Targets must reflect land use and opportunity
- Intermediate monitoring is essential
- TAWS must be bespoke, not boilerplate
If we want greener, healthier, more resilient towns and cities, canopy cover analysis must become a core component of every Tree & Woodland Strategy — not an optional extra.